Statistics
I have extensive records of statistics. I have some Python scripts to log these stats semi-automatically.
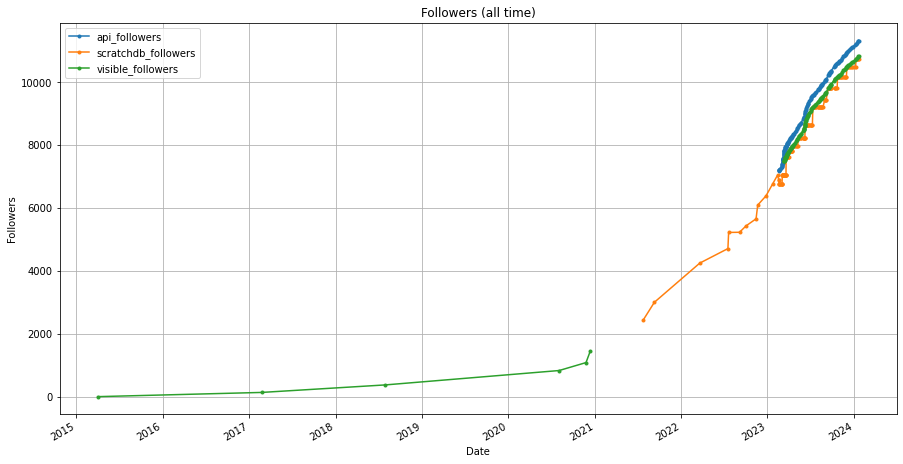
The 3 different lines correspond to different data sources. Visible followers is the number as seen in the followers page and is usually the value people refer to as follower count. As for the API, it includes deleted accounts which is why it is a bit higher than the others. Scratch DB was an unofficial API pulling data from the official API.
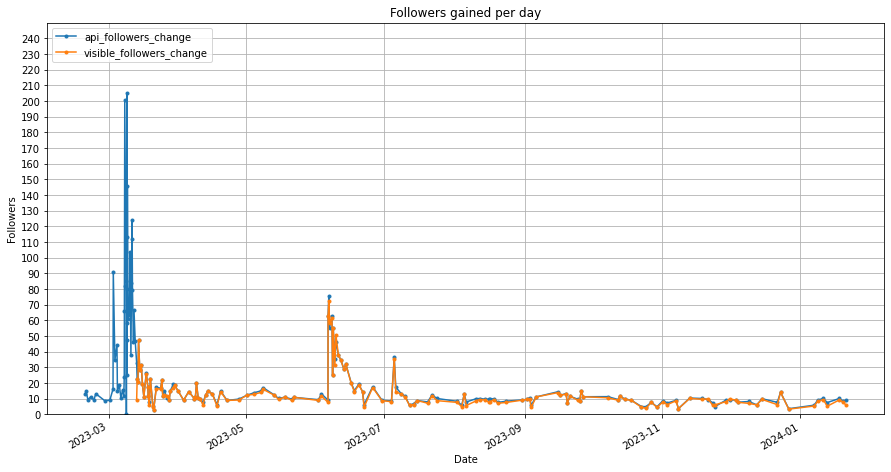
The change in follower count over time. Uses the same data as the previous graph. Spikes indicate high follower gains (occurs when I share projects).

Views for a bunch of notable projects. Car Parking Challenge is by far the most popular.
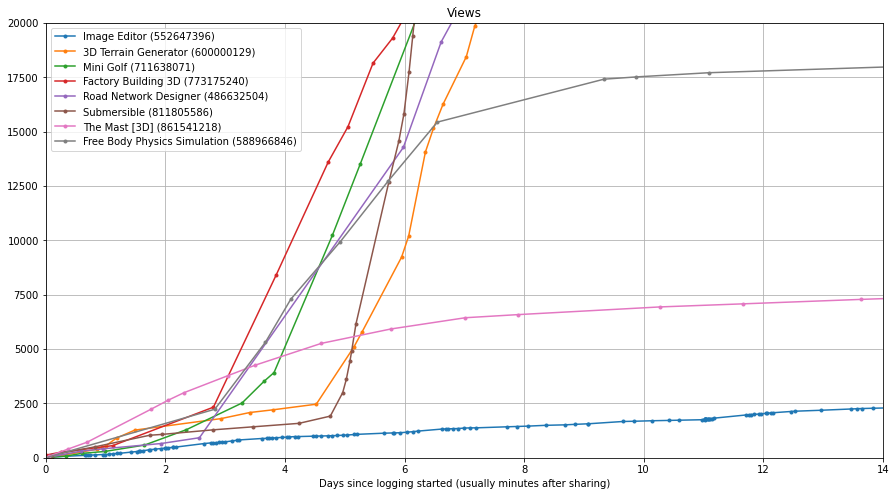
Views for my projects, aligned so performance can be compared. Some projects get on trending, others don't.
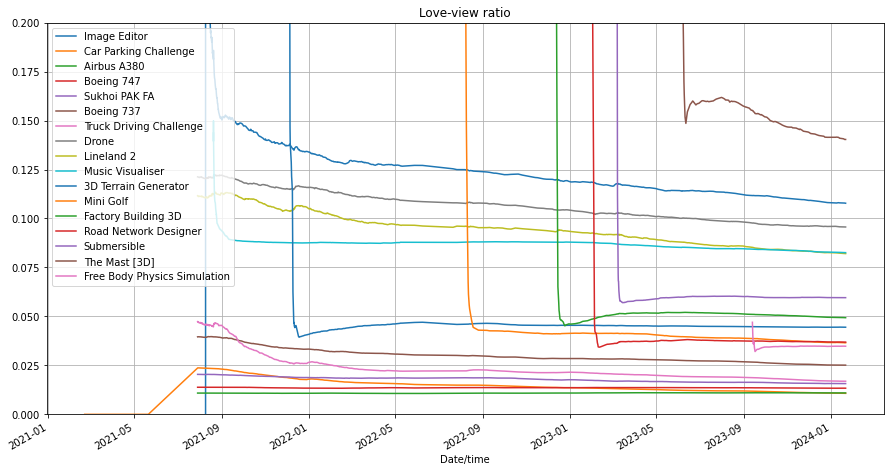
Views/loves. Higher is better (more views turned into loves).
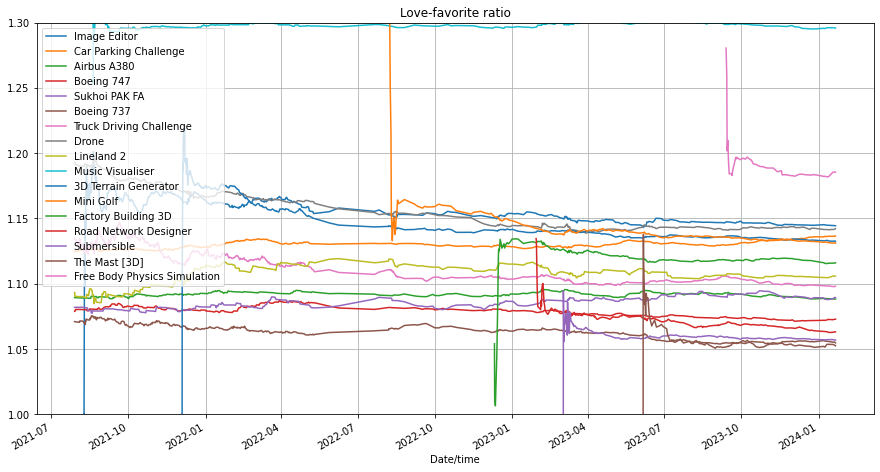
Loves/favorites. Lower means more favorites (which is probably a good thing, they are more valuable than loves).
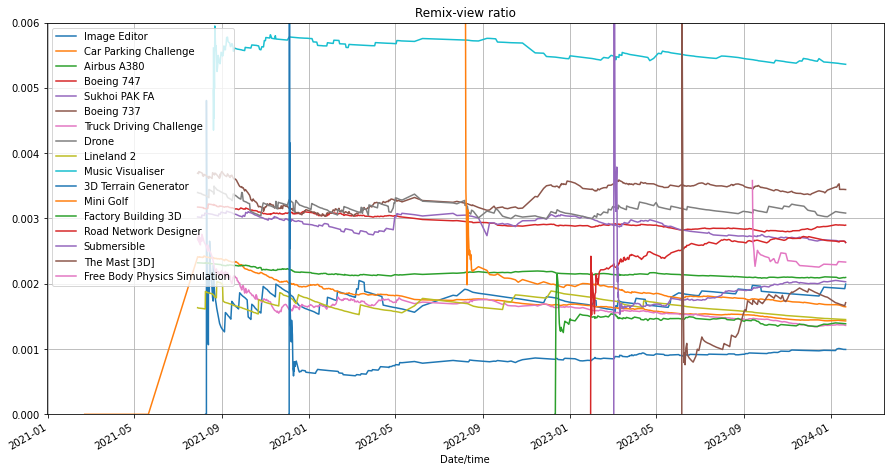
Remixes/views. Higher means more remixes. Some projects influence more remixing than others.

Messages received per day. The largest peaks are due to sharing projects (The Mast, Procedural Sandbox, and Animdustry).
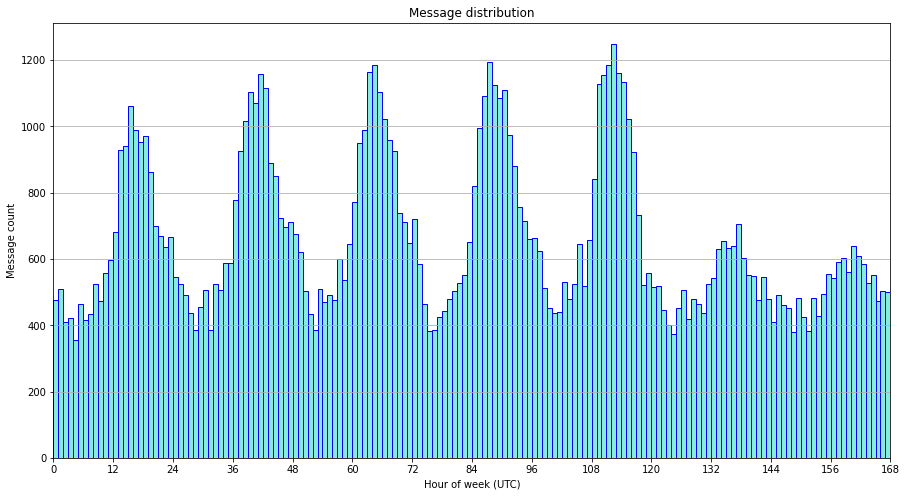
Messages counted by the hour of the week they are received, starting from monday. 110000 messages in total.